Metrics in Agile
Feb 5, 2016 by Svetlana Mukhina
As you know, in Agile it is very important to inspect and adopt your process, and metrics can give you the necessary information to track your way and approach to the necessary destination. There not many metrics that I can advise you to gather on projects, but the most essential ones are capacity, velocity, requirements stability index, and burn-down charts. To my mind, that is the bare minimum and a very useful set. Let’s see how to gather it and what value it can bring to your team.
Capacity. It’s the number of ideal hours available during the next sprint, and it serves as a forecast about the time available to work on task implementation.
It can be used for a few things:
You can use the spreadsheet below to calculate your team capacity:

You may wonder what "load factor" is and what activities are included in it. Here is an example from one of the team. The lists should be formed individually for teams, so I advise using the chronometry procedure, where each team member is writing down all activities they do during the week. Then the team gathers together and sorts out the activities to load and ideal hour lists. The chronometry procedure helps the team clarify and make transparent all activities they are engaged in.

Velocity. It’s the number of story points completed during previous sprint(s).
It can be used to:
Using velocity statistics, it is also possible to visualize how team estimation is improving (or not) over time. This diagram shows how many story points were completed compared to the ones that had been planned, and it shows a summary of completed story points as well.

Note: Using velocity and capacity together helps to align workload based on past experience and the future availability of development time, while making planning more accurate and results more predictable. In capacity, you plan ideal hours, see who will be on vacation or holidays, and map this information in your average velocity. E.g. if the average velocity of your team is 80 story points and the average capacity is 40 hours per sprint, then when capacity is significantly reduced to 20h (as usually happens during the New Year holidays) the velocity should also be correspondingly decreased to 40sp.
Burn-down. It’s a visual representation of story points burned to a given moment. It allows us to:

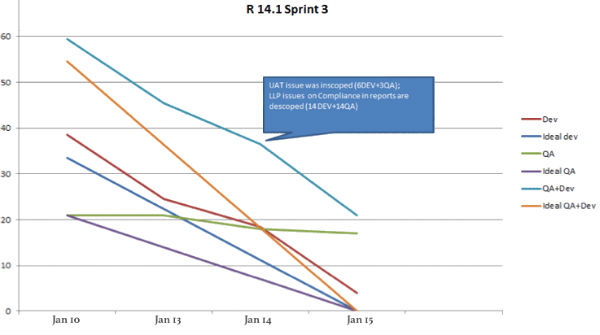
Below, you can see a burn-down chart with separate lines for QA and Developers. Please note that it's not a Scrum approach to tracking velocity, as in Scrum we count the entire team as a whole and focus on the whole team’s performance. Although this kind of separation can be done for some exceptional cases, it typically violates Scrum values and rules.

In order to make a burn-down chart more informative, you can add comments to it, describing why certain changes happen. In such a way you can share the burn-down with all stakeholders after a Standup meeting, so they also see not only the resulting progress but also the reasons for increases or decreases in team performance.

If you have several teams working on the same product, you can use individual burn-downs for the teams and a general one for the whole project. Again, make sure that all the teams understand the value of the product and focus not only on their own progress, but also the ‘big picture’ of progress on the project.

The next metric that I found helpful on Agile projects is the Requirements Stability Index. The RSI is used to measure changes in the business requirement added or deleted compared to the original requirements decided on at the start of the Sprint. It is calculated in the following way: Requirement Stability Index = (Total number of original business requirements + Number of requirements changed till date+ Number of requirements added + Number of requirements deleted) / (total number of original requirements)
Example:

The team can use RSI to:
Last but not least, I want to discuss in this post the work log. If the team tracks their time accurately in JIRA or another task/time-tracking system, they can also make use of the gathered data. It can help to:
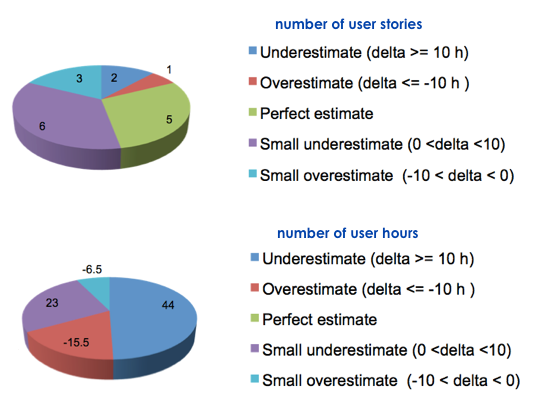
a) See what types of tasks are usually underestimated
b) To get information on re-opened tasks and investigate the reasons
c) To track personal performance

Please note that gathering metrics will not make the team work better by itself – the team must analyze the data and then define action items for improvement. Gathering metrics for the sake of gathering metrics is like measuring someone’s temperature and then taking no steps to cure them.
If you use any other metrics on your project and get value from them, I will be happy to hear the details!